Quality & Compliance
In-Process & SPC
Detect process drift while there is still time to protect the batch.
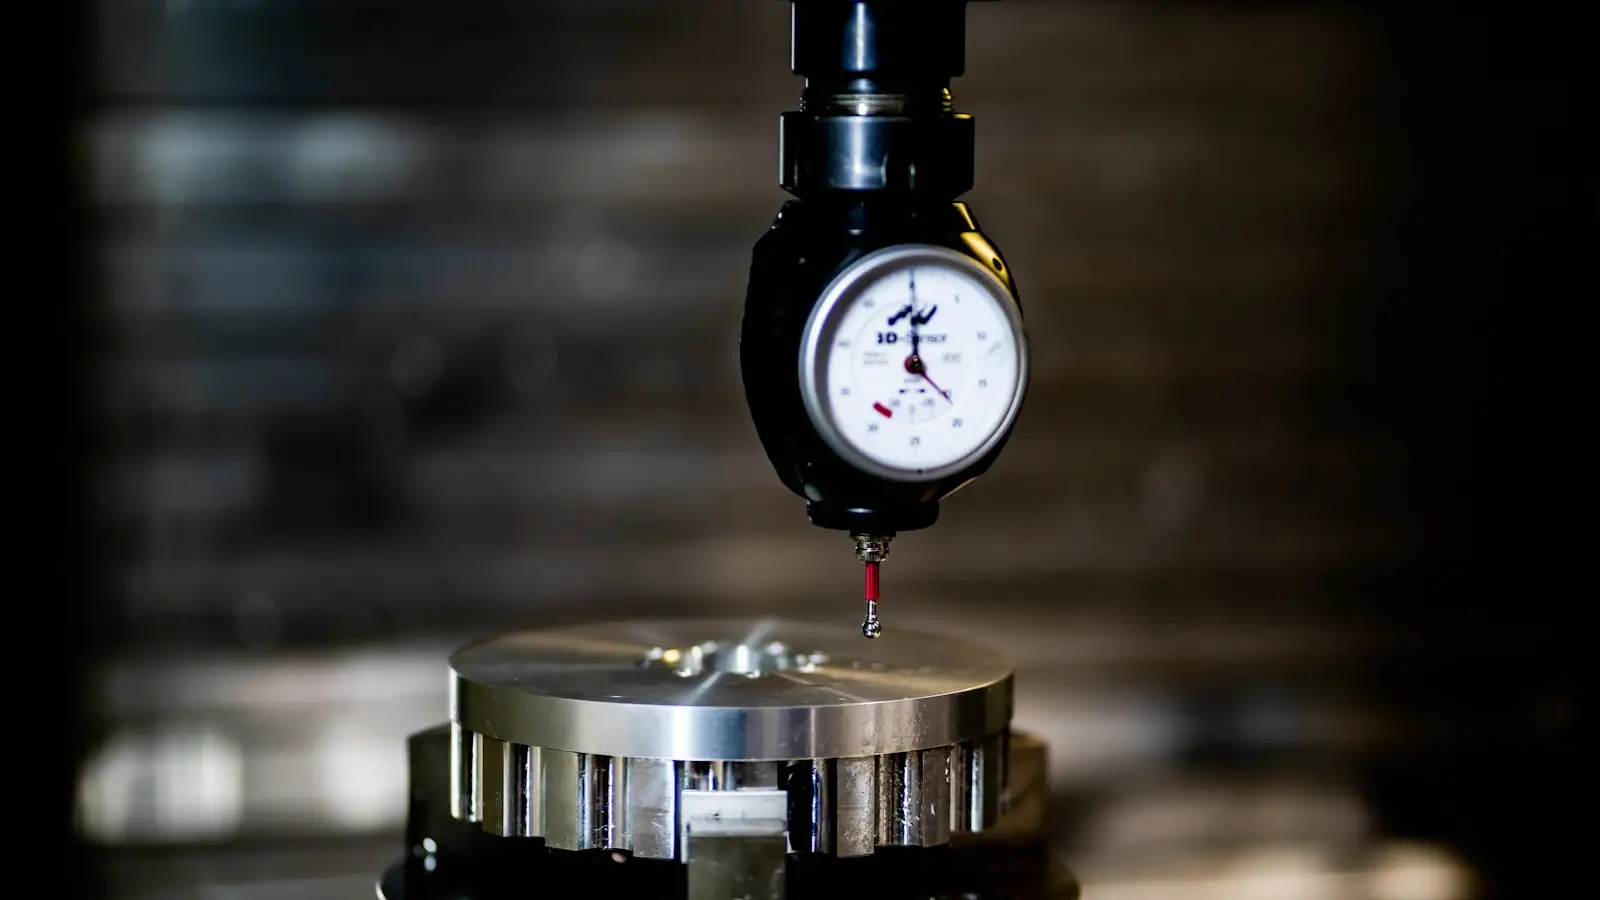
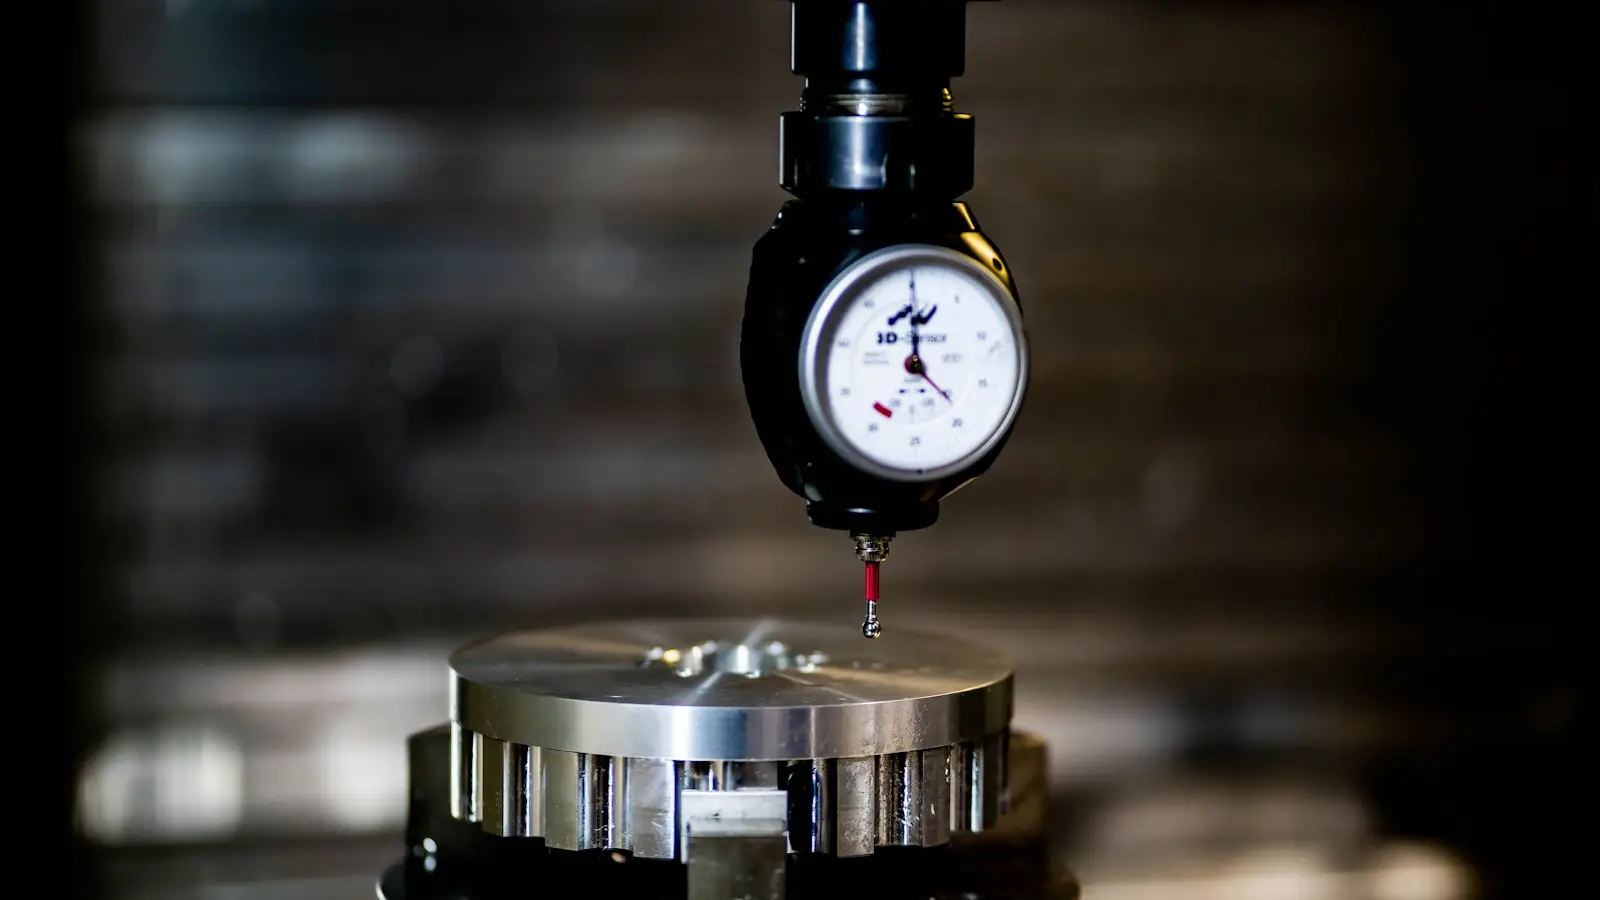
When in-process readings remain on paper until final inspection, teams lose the opportunity to correct drift before more material is affected. Phasis charts measurements as they are entered and alerts the floor when a control rule is broken.
Quality engineers define the characteristics and inspection plans. Inspectors and operators record readings during the round, and the chart establishes and locks control limits once enough baseline data is available. Corrections require a reason, preserve the original reading and update the chart.
Every measurement identifies the instrument used. Phasis prevents entry from an out-of-calibration gauge, and findings can create an NCR or CAPA directly in Quality.
Who uses it
Quality Engineer
Defines measurement plans and control limits, then manages chart recalculation.
QC Inspector
Completes inspection rounds and records the measurements.
Operator
Records readings at the line and sees the warning there.
Quality Manager
Reviews findings and starts an NCR or CAPA when follow-up is required.
How the process changes
- TodayInspection readings remain on paper until they are reviewed later.With PhasisReadings are entered once and charted immediately.
- TodayControl limits are copied or maintained separately from process data.With PhasisControl limits are calculated from the process baseline and then locked.
- TodayProcess drift is discovered after parts fail final inspection.With PhasisA control-rule violation raises a finding during production.
- TodayCapability figures are recalculated manually for reviews and audits.With PhasisCp and Cpk are available with the current process data.
- TodayCorrecting a measurement removes the original value.With PhasisCorrections preserve the original, require a reason and update the chart.
What you get
- Earlier warning of process drift, while production can still respond.
- Current Cp and Cpk figures based on the recorded process data.
- Measurement integrity through an automatic calibration-status check.
- Direct conversion of an in-process finding into an NCR or CAPA.
See how Phasis fits your operation.
Tell us which process you want to improve. We will show the relevant workflow using the lines, shifts and decisions your team handles every day.